09 Apr Assessments by the numbers
By Dale Chu

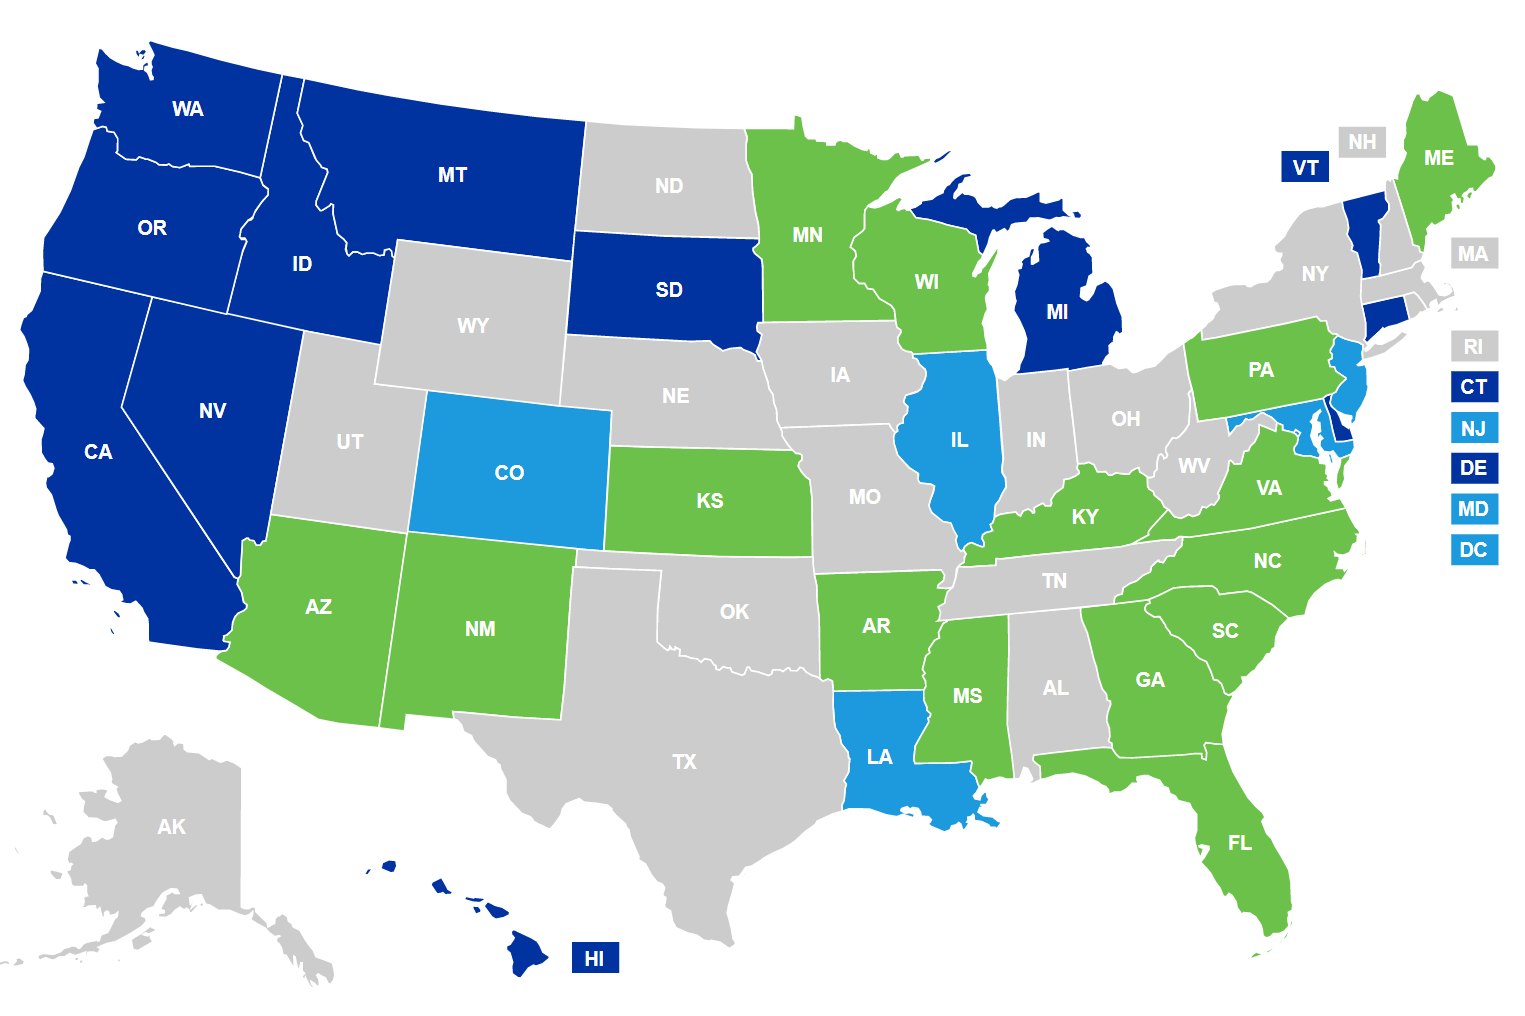
With all of the coronavirus related news vis-à-vis testing, I’ve neglected to mention the exciting updates we’ve made to Assessment HQ’s Explore State Data tool. Here are some of the notable ones, which reflect state data released at the end of last year:
– 33 states have comparable data from 2016 through 2019.
– An estimated 19.5 million students in grades 3-8 are now represented, according to the most recent NCES enrollment data.
– 27 states featured on our tool have publicly available data disaggregated by student group.
– There are 12 states using Smarter Balanced, 6 using PARCC (state-comparable), and 15 states are using non-consortia assessments.
– Iowa and Indiana no longer have comparable data because of recent changes to their state assessments. I’ve spilled a lot of ink on the problems created when this happens, notably here and here.
– Notwithstanding the state’s claims that their data is still comparable, New Mexico’s testing churn will be worth watching. Earlier this year, I spoke with NewMexicoKidsCAN’s Amanda Aragon about what’s happening.
Please keep this new information in mind as you explore the tool. The elephant in the room, of course, is what the future holds for the first bullet point—comparability—now that the federal government has waived spring testing for every state. Will some states instead choose to test this fall or will this school year simply be considered a mulligan? Lots of implications downstream, which we’ll delve into in future posts.


No Comments